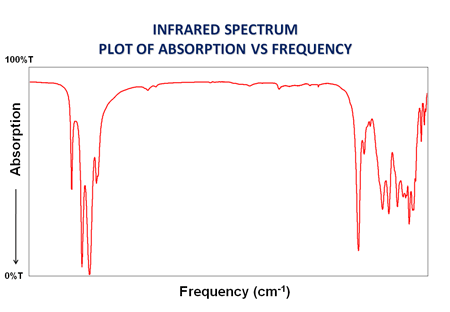
Infrared spectroscopy (IR) gives a unique “chemical overview” of a sample, with all the chemicals present contributing to the spectrum produced. It can be applied to non-crystalline materials as well as crystalline materials, and organic as well as inorganic materials. The technique allows the qualitative analysis of a large variety of samples ranging from biological samples to clay minerals. Identification of unknowns is possible through expert interpretation of spectra, in conjunction with the use of spectral libraries. Although the analysis done using IR is largely qualitative, quantitative work is also possible. Near infrared spectroscopy (NIR) is a related technique which, through calibration procedures, allows the quantification of various characteristics in a wide range of materials from foodstuffs to soil.
The section is equipped with a Fourier transform infrared (FTIR) spectrometer, an FTIR microscope and a Near infrared (NIR) spectrometer. The FTIR spectrometer can be used in conjunction with several different sample holding accessories, including Diamond Attenuated Total Reflectance (DATR) and Horizontal Attenuated Total Reflectance (HATR) attachments, giving great flexibility in the type of samples that can be analysed. The DATR allows samples to be run in their natural state and to be completely recovered afterwards. The HATR allows spectra of liquids and solutions to be readily obtained.
Typical Samples
Typically, many of the samples analysed using the FTIR spectrometer are “problem samples” which involve identification of components in complex mixtures such as scales, deposits, drilling fluids and muds from the oil industry. Characterisation of paints or the analysis of soils from contaminated land is also typical of the analyses undertaken in this section. The use of the FTIR microscope ranges from the identification of fibres to mapping of chemical composition in biological thin sections. The NIR system, which is currently under development, can be used for example in the rapid analysis of various properties of animal feedstuffs such as protein, crude fat and fibre content.


